
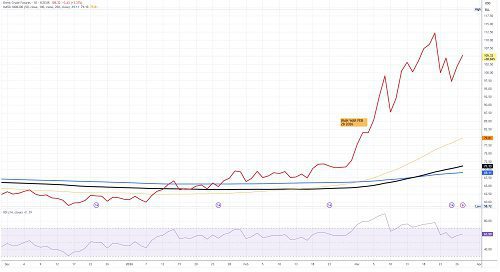
Global oil indices have experienced dramatic volatility in March 2026, with Brent crude briefly testing the $119.50-per-barrel level in March 9, following a severe escalation in the US-Iran war. Despite a structural, long-term outlook of oversupply, immediate fears surrounding the closure of the Strait of Hormuz—through which 20% of global oil travels—have embedded a heavy risk premium into oil prices.
Brent crude added 3.32% to $105.32 on March 27, while it remains nearly 48% higher than it was just one month ago.
The interesting part is how fragile this setup is. If tensions cool even slightly, a lot of this “fear premium” could evaporate quickly. Oil has a habit of spiking hard and then drifting lower once the panic fades. A move back toward the $60–$70 range isn’t unrealistic if the geopolitical situation stabilizes, especially with supply still looking strong in the background.
The March Rally: Geopolitics Over Fundamentals
What’s driving this isn’t some sudden shift in long-term supply and demand. It’s fear—plain and simple. The escalation between the U.S., Israel, and Iran has turned the Strait of Hormuz into a massive question mark, and that’s enough to send traders scrambling. When roughly a fifth of the world’s oil flows through a single chokepoint, even the possibility of disruption is enough to jack up prices fast.
The Hormuz Crisis: Following U.S. and Israeli military strikes on Iran in late February, Iranian forces have effectively stalled traffic through the Strait of Hormuz, forcing shipping re-routes and spiking insurance costs.
Brent crude spiked past $100 a barrel in March, representing a major surge from sub-$65 levels seen in early January 2026.
Shipping delays, rising insurance costs, and reports of stalled traffic in Hormuz are doing more to move prices than any inventory data release. Even production cuts in the Gulf right now aren’t strategic—they’re logistical. Oil is backing up because it can’t move efficiently.
The Great Divergence: Short-Term Pain vs. Long-Term Glut
While oil spot prices are high, energy economists warn that the market fundamentals remain bearish. J.P. Morgan and the EIA have previously forecasted that supply from non-OPEC+ producers (notably Brazil, Guyana, and the U.S.) is outpacing demand.
“Prices rise like a rocket, fall like a feather,” noted Mark Zandi, chief economist at Moody’s Analytics. If geopolitical tensions de-escalate, analysts expect a rapid reversion to the $60–$70 range as the persistent oversupply will be the dominant theme once again.
Check the latest oil price target from the best analysts in our post
Economic Consequences: A New Inflationary Wave
The longer prices stay elevated, the more real economic damage starts to show up. We’re already seeing the early effects—higher fuel costs feeding into transportation and food prices. If Brent holds above $100 for long, it’s not just an energy story anymore; it becomes an inflation problem. And if that sticks, central banks don’t get the breathing room they’ve been hoping for.
High oil prices are making motor fuel, transportation, and food more expensive, threatening a new inflationary wave.
Elevated crude prices act as a classic supply-side shock. Every sustained $10/bbl increase in Brent typically adds 0.2–0.4 percentage points to global headline inflation through higher transportation, petrochemical, and manufacturing costs.
Analysts, including BlackRock’s Larry Fink, have warned that if oil prices remain above $100 for an extended period, it could trigger a global recession.
Oil Price Key Drivers
Ceasefire Hopes: Market prices have shown extreme sensitivity to rumors of negotiations, with prices slipping on March 25 due to hopes of de-escalation.
OPEC+ Strategy: Despite the crisis, OPEC+ has been aiming to resume output hikes, testing the production capabilities of members.
China Demand: China has continued to purchase large volumes, primarily to fill its strategic reserves, providing a floor for oil prices even if demand slows elsewhere.
The Conflict Catalyst: Prices spiked sharply following U.S. and Israeli military actions in Iran on February 28, which led to a partial closure of the Strait of Hormuz—a chokepoint for 20% of global oil. A prolonged blockage could send prices toward $140–$150, potentially triggering a global recession.
U.S. Production: Despite the price surge, the U.S. Energy Information Administration (EIA) expects domestic production to average 13.6 million bpd in 2026, a slight increase from previous years, potentially acting as a buffer against disruptions in the Middle East. 2026 supply still projected to outpace demand by nearly 2m b/d, despite short-term disruptions
Global Demand: The International Energy Agency (IEA) projects demand growth of 930,000 bpd in 2026, primarily driven by non-OECD economies such as China and India.
The oil market currently operates with a high “fear premium” of roughly $10 per barrel. At the same time, fundamental forecasts suggest a surplus in 2026, the potential for sustained disruption in the Middle East has created an asymmetric upside risk, making volatile, high-priced oil the base case for the near future.
Scenario Analysis: Where Oil Price Could Go From Here
At this point, the rest of 2026 really comes down to how long this geopolitical tension sticks around. Strip away the headlines, and you can sketch out three pretty realistic paths—none of them especially stable.
1. The “this blows over” scenario (still the most likely)
The most probable outcome is that Hormuz disruption ends up being temporary—messy, expensive, but not lasting. Maybe a few weeks, maybe a couple of months, but not something that fundamentally breaks the system.
If that’s how it plays out, oil probably peaks sometime in Q2 and then gradually drifts lower. The supply story hasn’t gone anywhere: U.S. shale is still growing, Brazil and Guyana are still adding barrels, and once flows normalize, inventories will start rebuilding again.
In that world, Brent averaging somewhere in the $75–85 range feels about right. By year-end, you’re likely back in the $60s or low $70s. It’s not a collapse—it just looks like a market returning to reality after a panic spike.
2. The “this drags on longer than expected” scenario
This is where things get uncomfortable. You don’t need a სრული shutdown of Hormuz—just ongoing friction. Higher insurance costs, hesitant shipping, periodic disruptions. That alone can keep a meaningful chunk of supply effectively sidelined.
If that drags on, oil doesn’t just stay elevated—it stays structurally tight. You’re probably looking at $90–110 on average, with periodic spikes above $120 whenever tensions flare.
The catch is that high prices eventually solve the problem. Demand starts to crack, especially in more price-sensitive economies. But that adjustment takes time, and in the meantime you get stickier inflation, tighter financial conditions, and a much higher risk of policy mistakes. This is the scenario central banks really don’t want.
3. The “everyone overreacted” scenario
There’s also a case—less talked about, but very real—where this unwinds faster than expected. Flows normalize quickly, geopolitical risk fades, and suddenly the market has to refocus on what it was worried about before all this started: too much supply.
If non-OPEC production keeps growing and demand underwhelms (China is the obvious wild card here), you could flip from perceived scarcity to a visible glut pretty quickly. Inventories would build, sentiment would turn, and prices could slide into the $50–65 range by late 2026.
At that point, the pressure shifts. It’s no longer about inflation—it’s about producer stress. Higher-cost barrels get squeezed, and OPEC+ cohesion starts to look shaky again.
The bigger picture
What makes this moment tricky is that all three scenarios are plausible—and the market is bouncing between them almost daily. Right now, prices are being driven by fear, not fundamentals. But that can change fast.
If there’s one consistent pattern in oil, it’s this: spikes tend to overshoot, and once the risk fades, the drop can be just as sharp—just slower and more frustrating on the way down.
Oil Price Technical Analysis
Brent crude ended the week at $105.32 with daily gains of 3.32%, while it ended the week 1.73% lower. Bullish momentum is intact but fragile. The oil market is in deep backwardation, spot prices higher than futures prices, indicating severe near-term supply tightness.
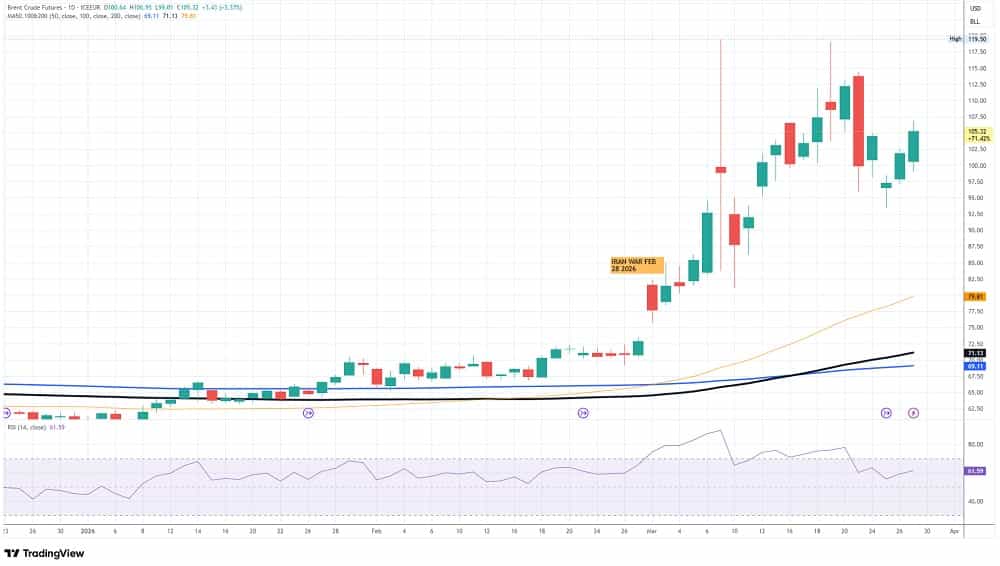
As we enter the new week, bulls would meet immediate resistance at $106.95, the top from the Friday session. The next target to the upside is the $114.43 high from Monday, March 23. A fast escalation in the Iran war might target the recent top at $119.50. A break above that would open the way for the $139 highs from March 2022.
On the flipside, support stands at $99, the Friday trading session’s low. A move below might challenge the $93 mark, which is the low from Wednesday, March 25. A de-escalation of the Iran war and an improvement in the move at the Hormuz Strait might challenge $81, the low from March 10.
Oil is trading less like a commodity and more like a geopolitical asset. Traders and investors should be very carefull as headlines matter more than fundamentals, and sentiment is shifting almost daily. You can see it in how quickly prices react to even vague hints of ceasefire talks.
All in all, we’re stuck in this strange split: structurally, the market looks oversupplied; in the short term, it feels anything but. And until that tension resolves—one way or the other—volatility is probably the only safe bet.

Nikolas has been involved in the finance industry for over fifteen years spanning across Europe and USA with a depth of knowledge and experience within many aspects of the financial markets. Nikolas gained several years experience with some of the Europe’s leading Brokers, as equity analyst, and trader managing accounts for both Private and Corporate Investors. He enjoys both the fundamental and technical aspects of trading focusing on stock markets and all FX majors. Currently, Nikolas provides analysis and comments to online financial publications. Educational background in Economics (BSc), and Finance (MSc).